Blog , July 31, 2021
Chrome Developer Tools
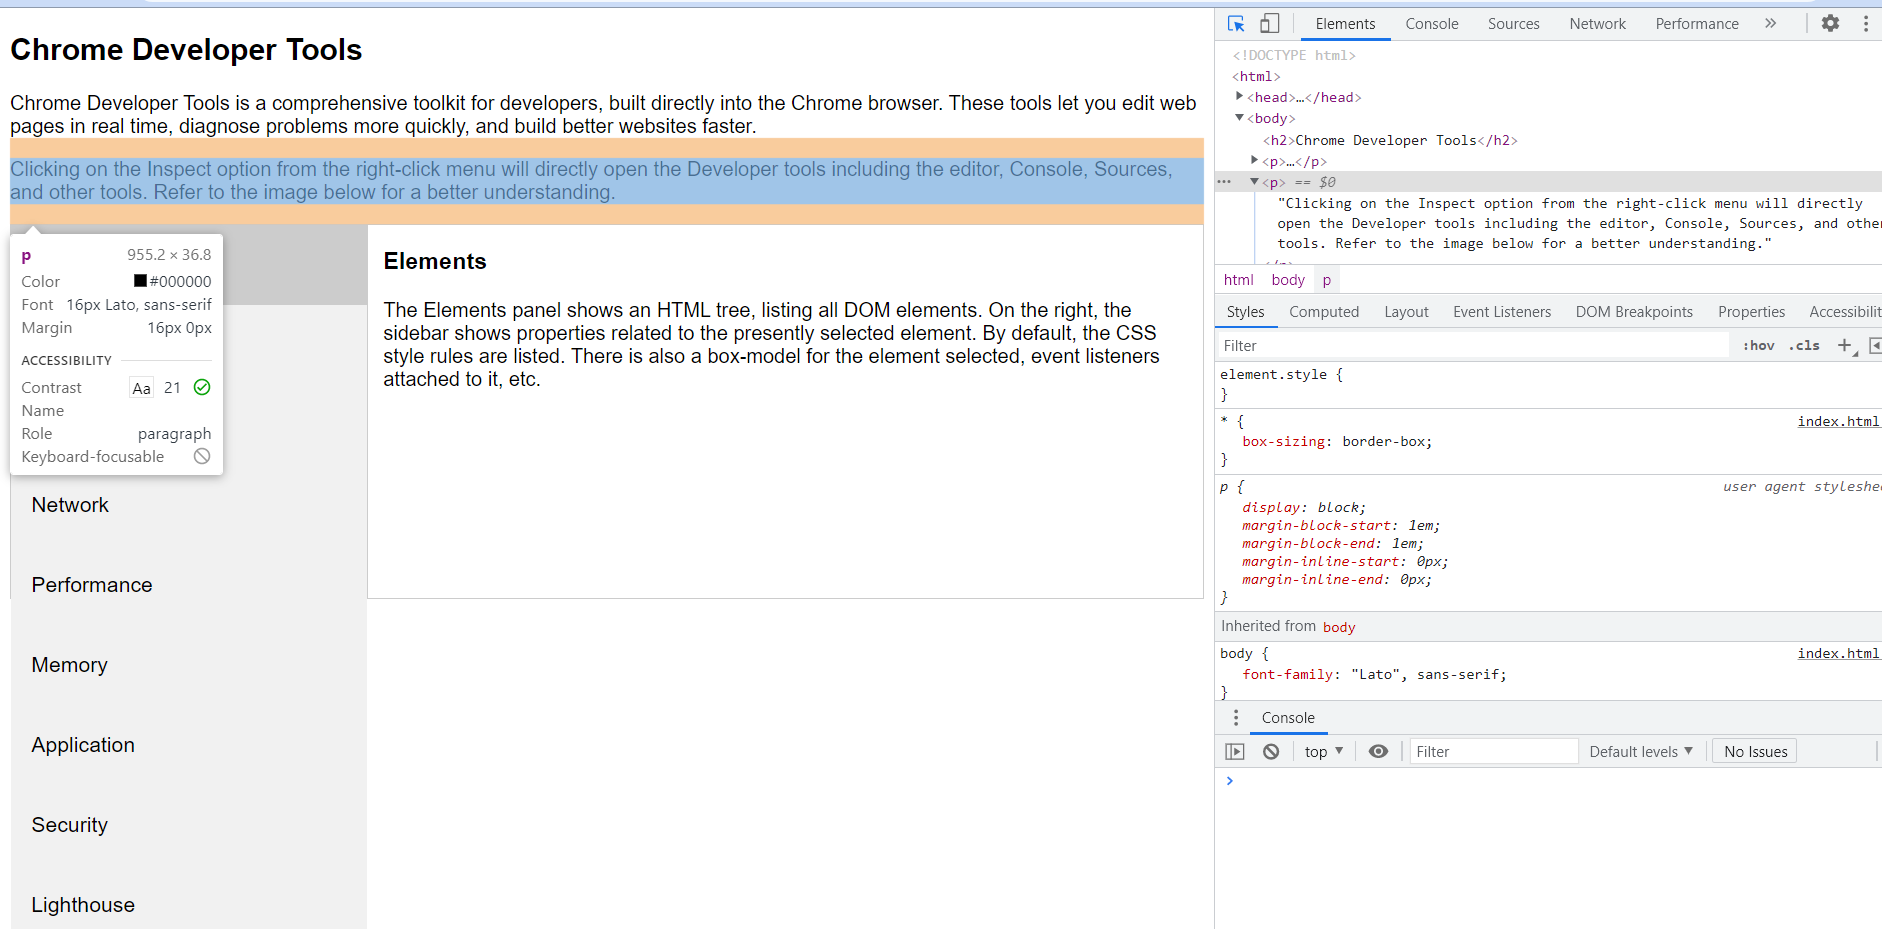
Elements
The Elements panel shows an HTML tree, listing all DOM elements. On the right, the sidebar shows properties related to the presently selected element. By default, the CSS style rules are listed. There is also a box-model for the element selected, event listeners attached to it, etc.
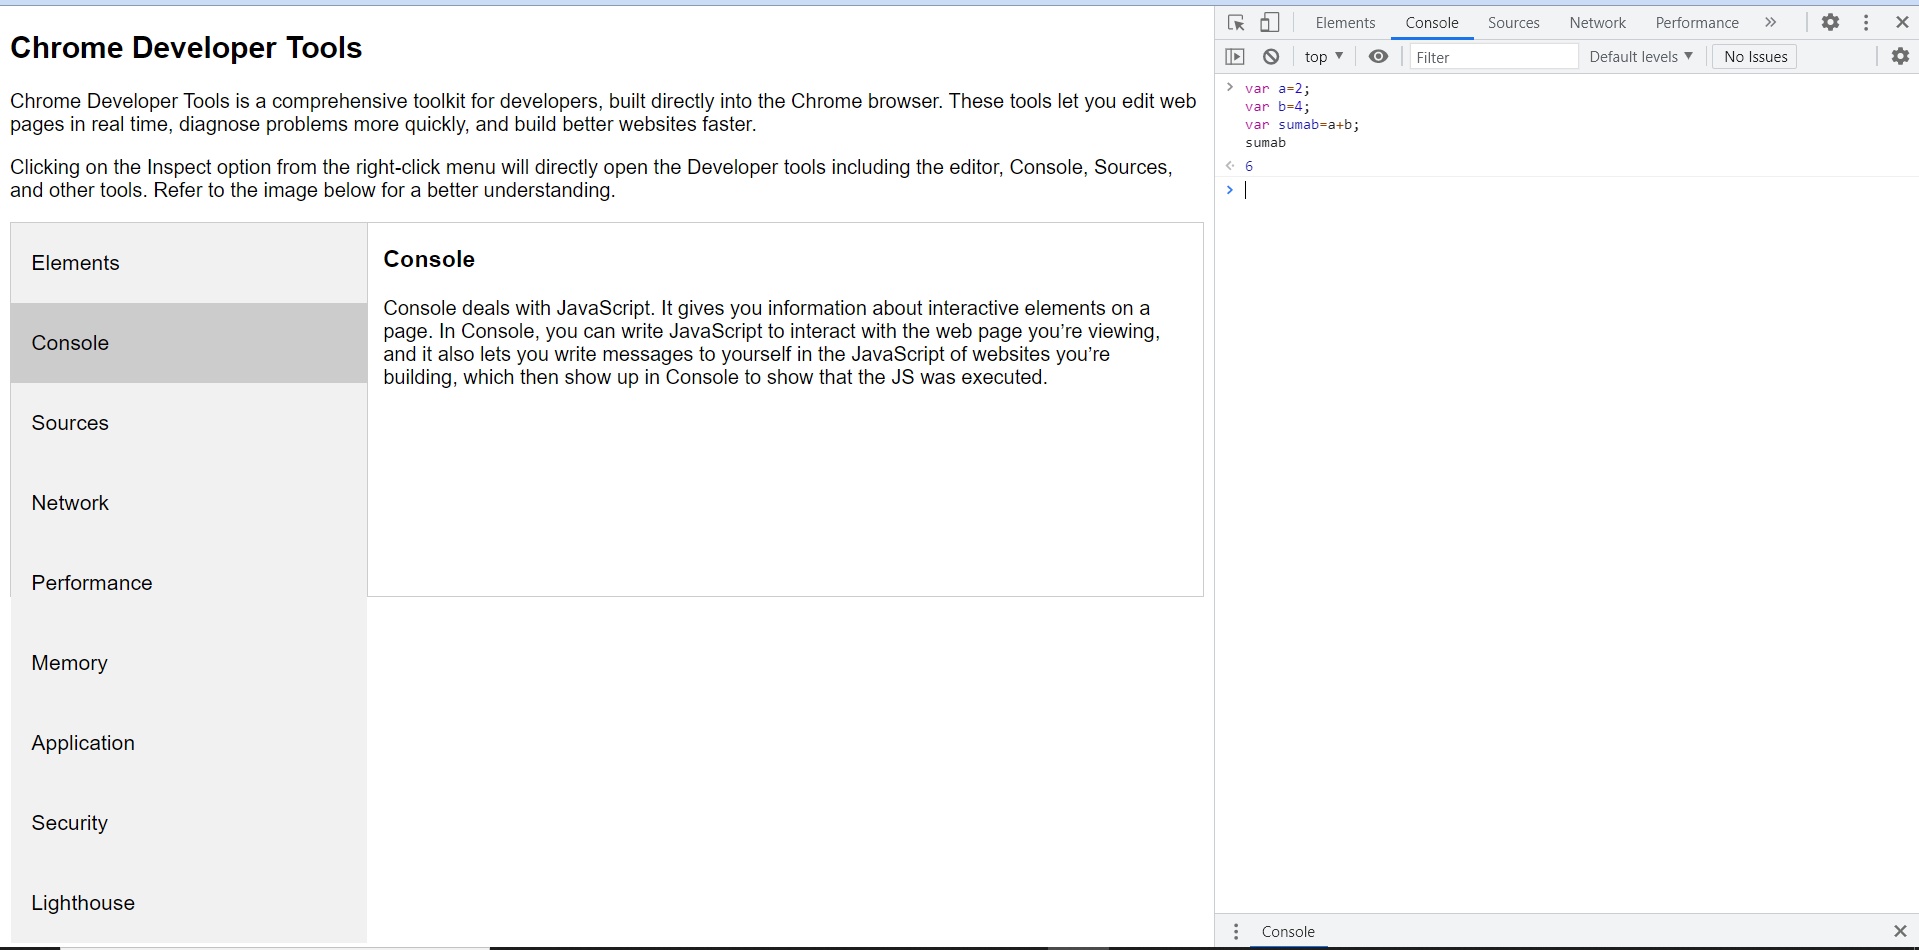
Console
Console deals with JavaScript. It gives you information about interactive elements on a page. In Console, you can write JavaScript to interact with the web page you’re viewing, and it also lets you write messages to yourself in the JavaScript of websites you’re building, which then show up in Console to show that the JS was executed.
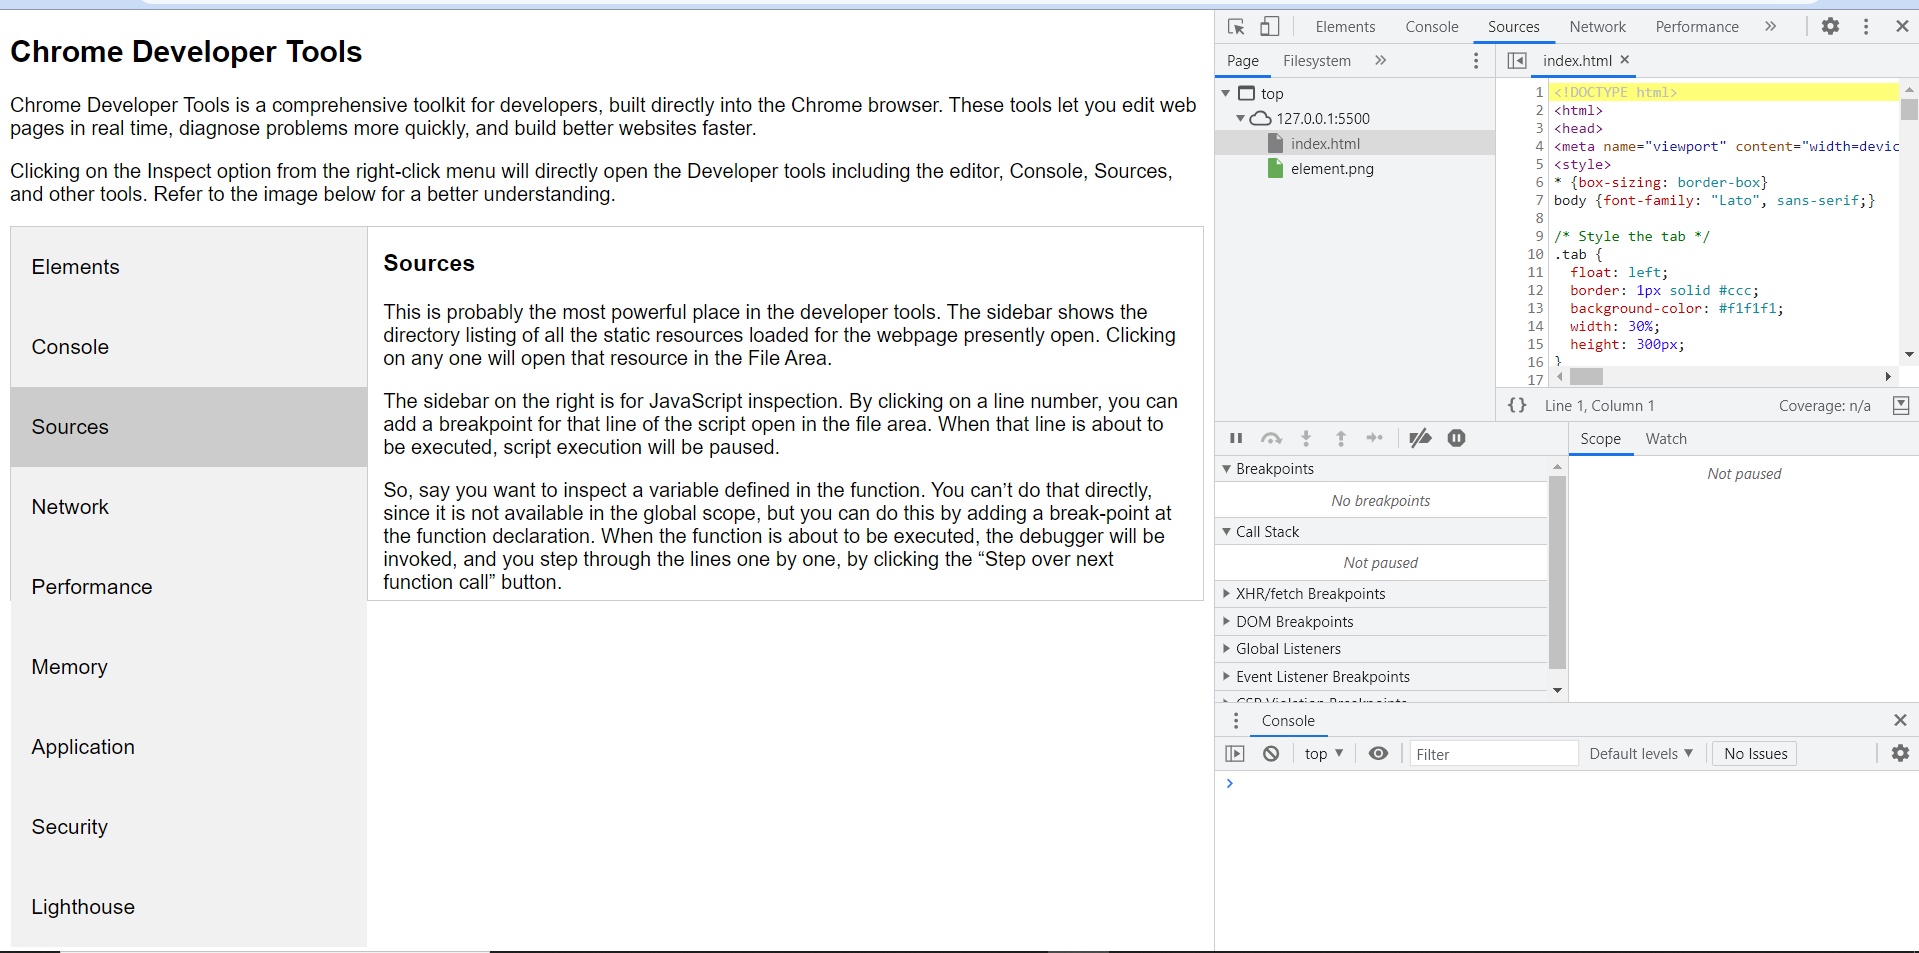
Sources
This is probably the most powerful place in the developer tools. The sidebar shows the directory listing of all the static resources loaded for the webpage presently open. Clicking on any one will open that resource in the File Area.
The sidebar on the right is for JavaScript inspection. By clicking on a line number, a breakpoint can be added for that line of the script open in the file area. When that line is about to be executed, script execution will be paused.
To inspect a variable defined in the function. We can’t do that directly, since it is not available in the global scope, but we can do this by adding a break-point at the function declaration. When the function is about to be executed, the debugger will be invoked, and we step through the lines one by one, by clicking the “Step over next function call” button.
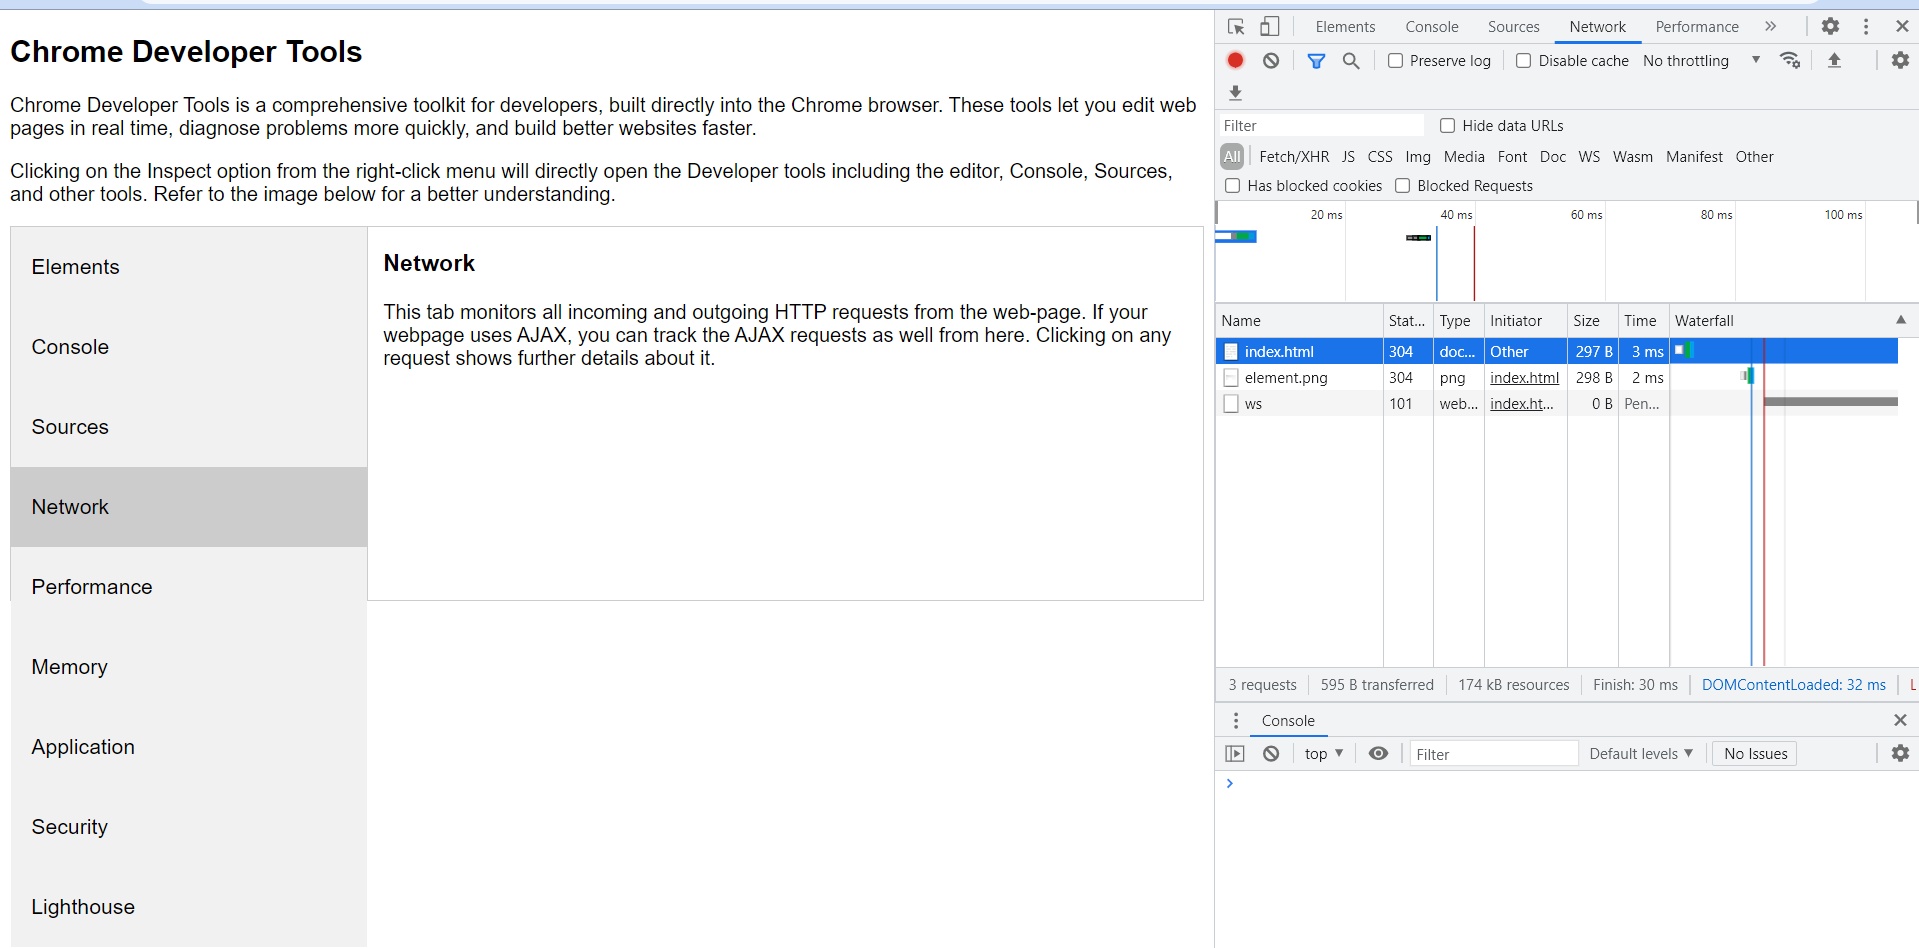
Network
This tab monitors all incoming and outgoing HTTP requests from the web-page. If webpage uses AJAX, we can track the AJAX requests as well from here. Clicking on any request shows further details about it.
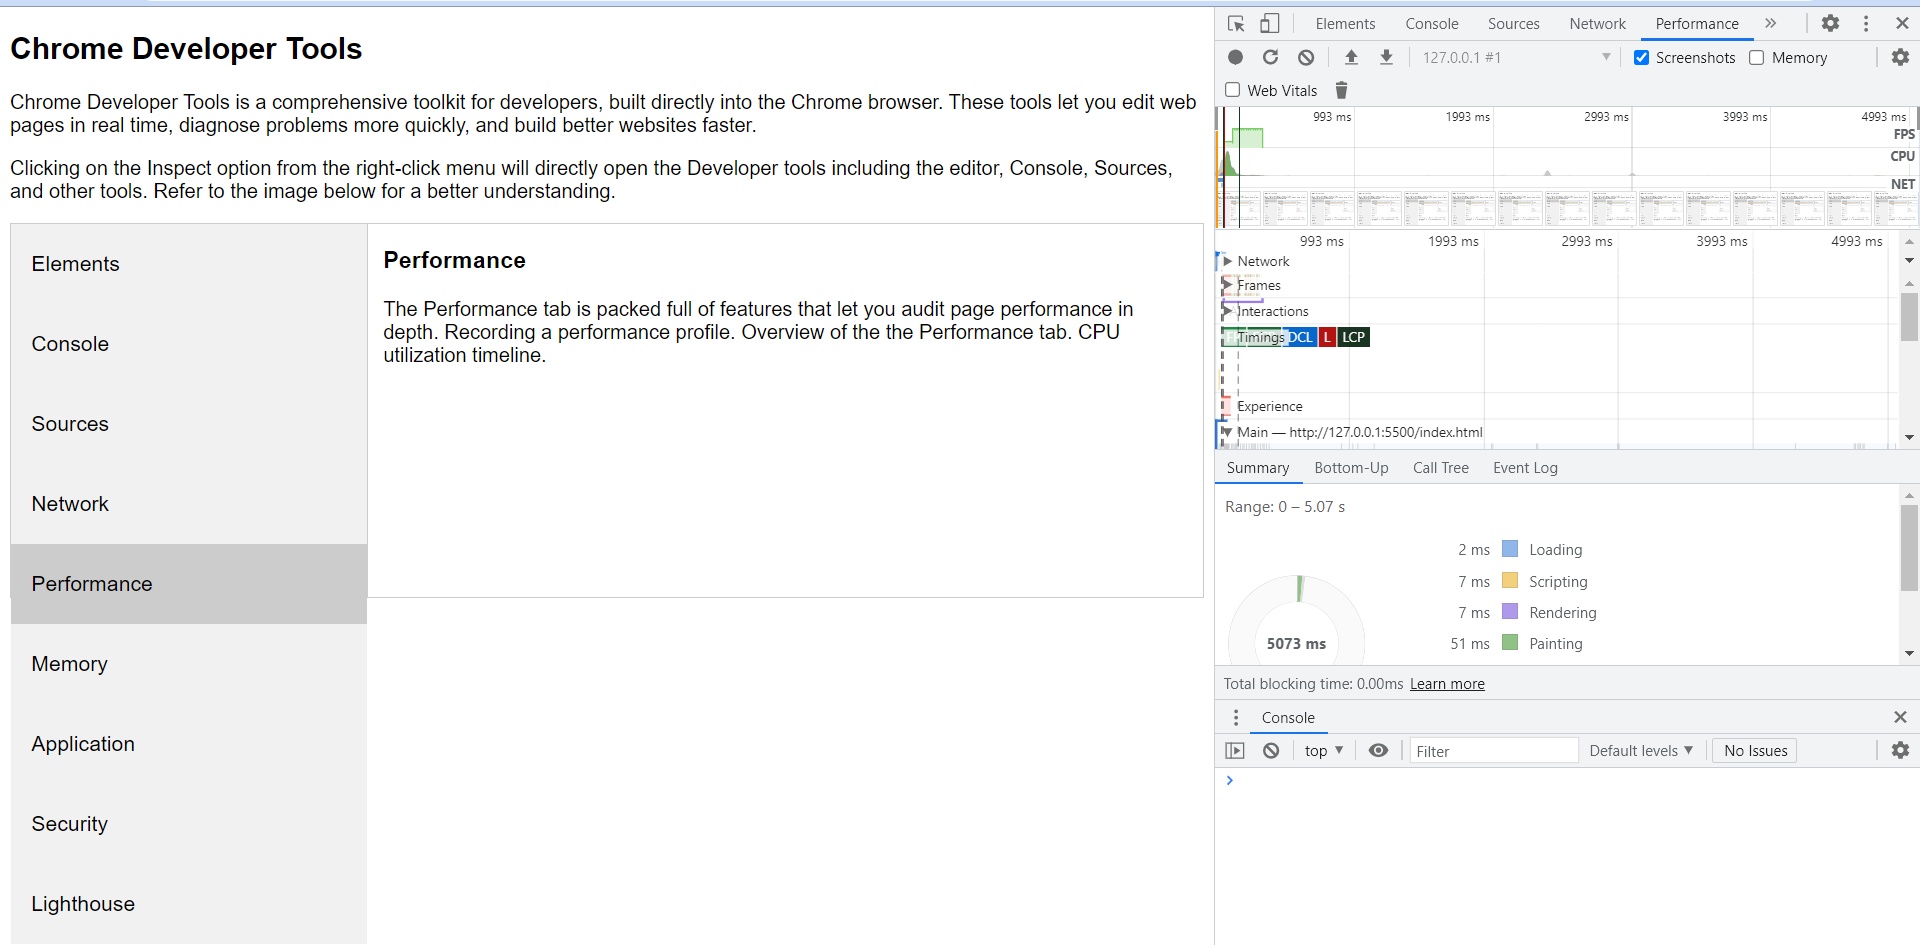
Performance
The Performance tab is packed full of features that let audit page performance in depth. Recording a performance profile. Overview of the the Performance tab. CPU utilization timeline.
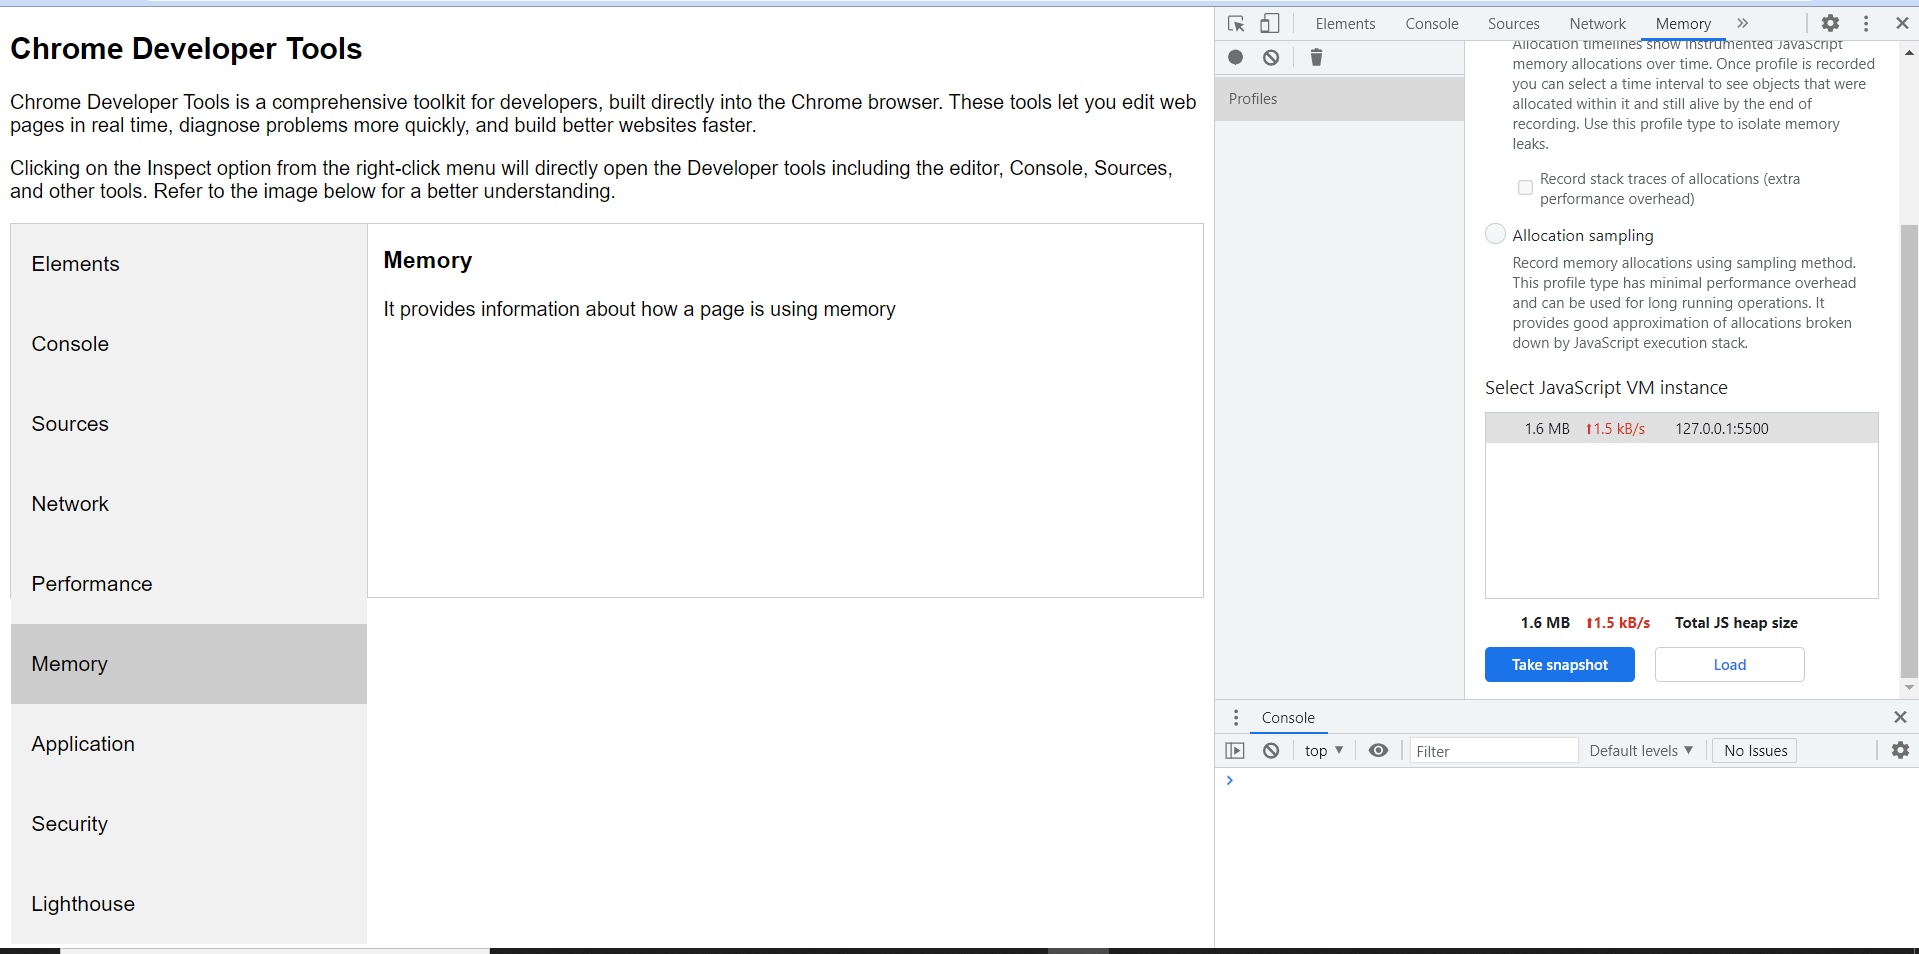
Memory
It provides information about how a page is using memory
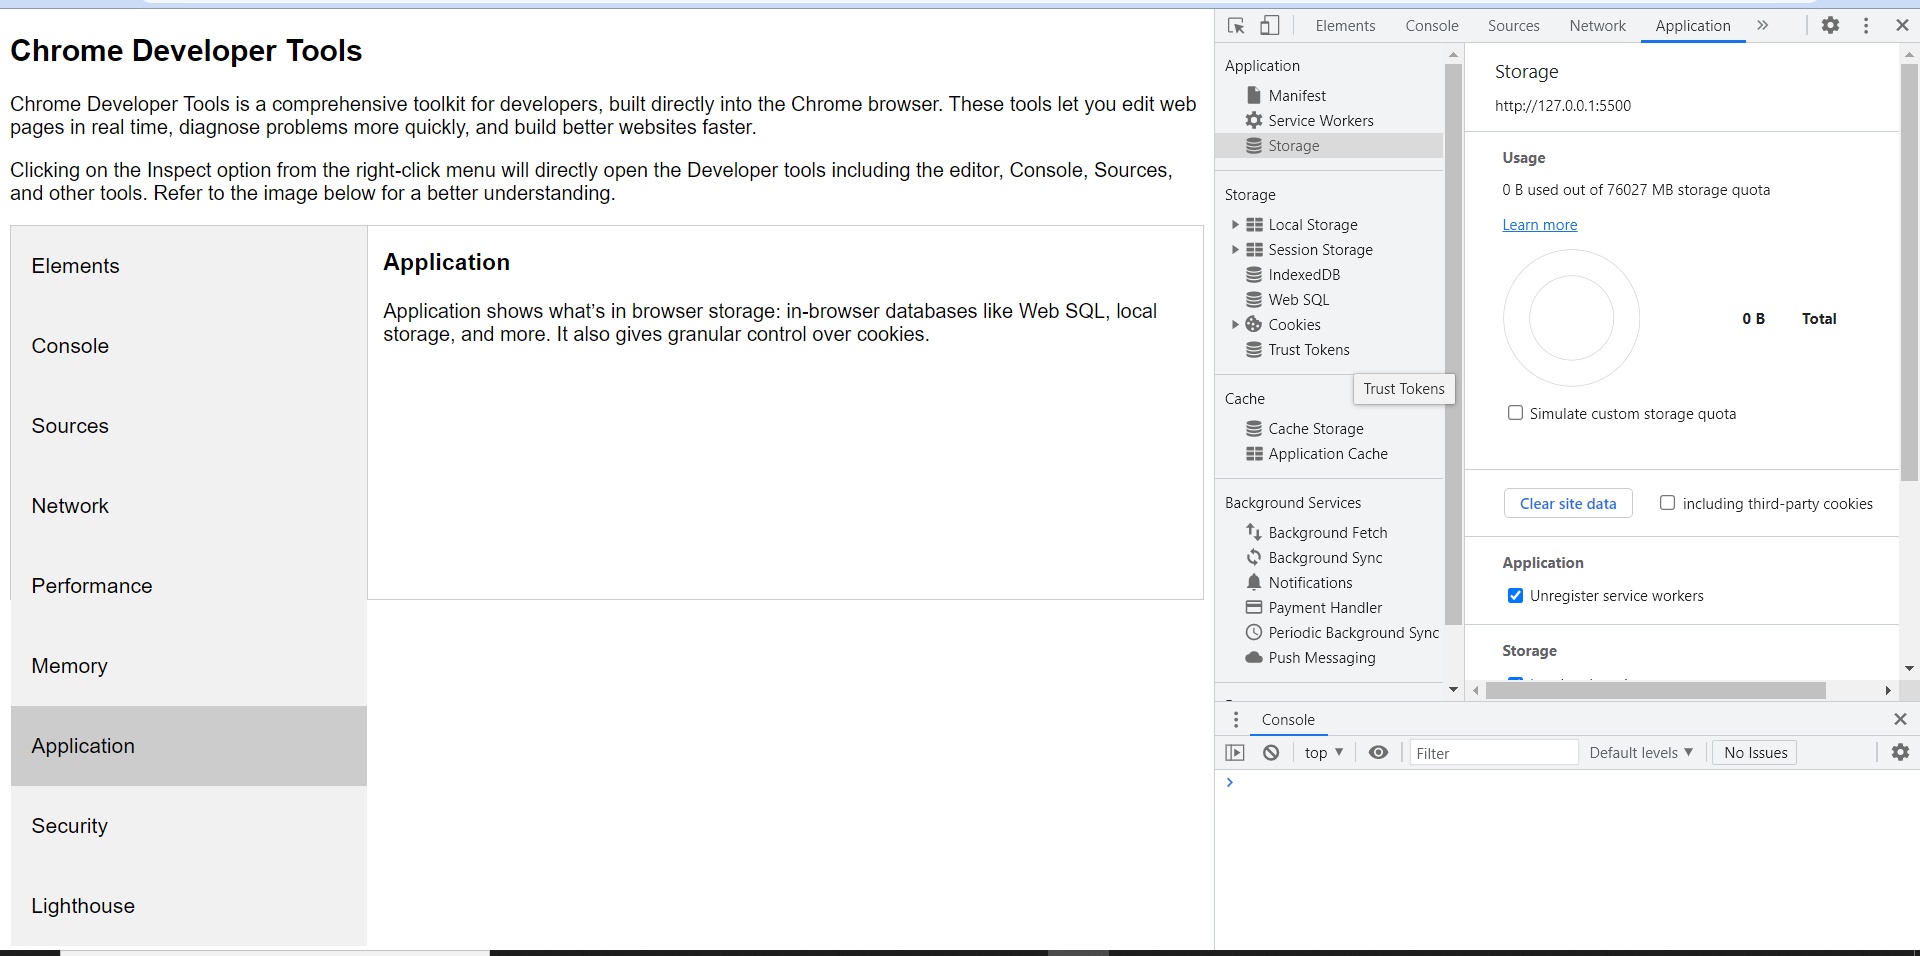
Application
Application shows what’s in browser storage: in-browser databases like Web SQL, local storage, and more. It also gives granular control over cookies.
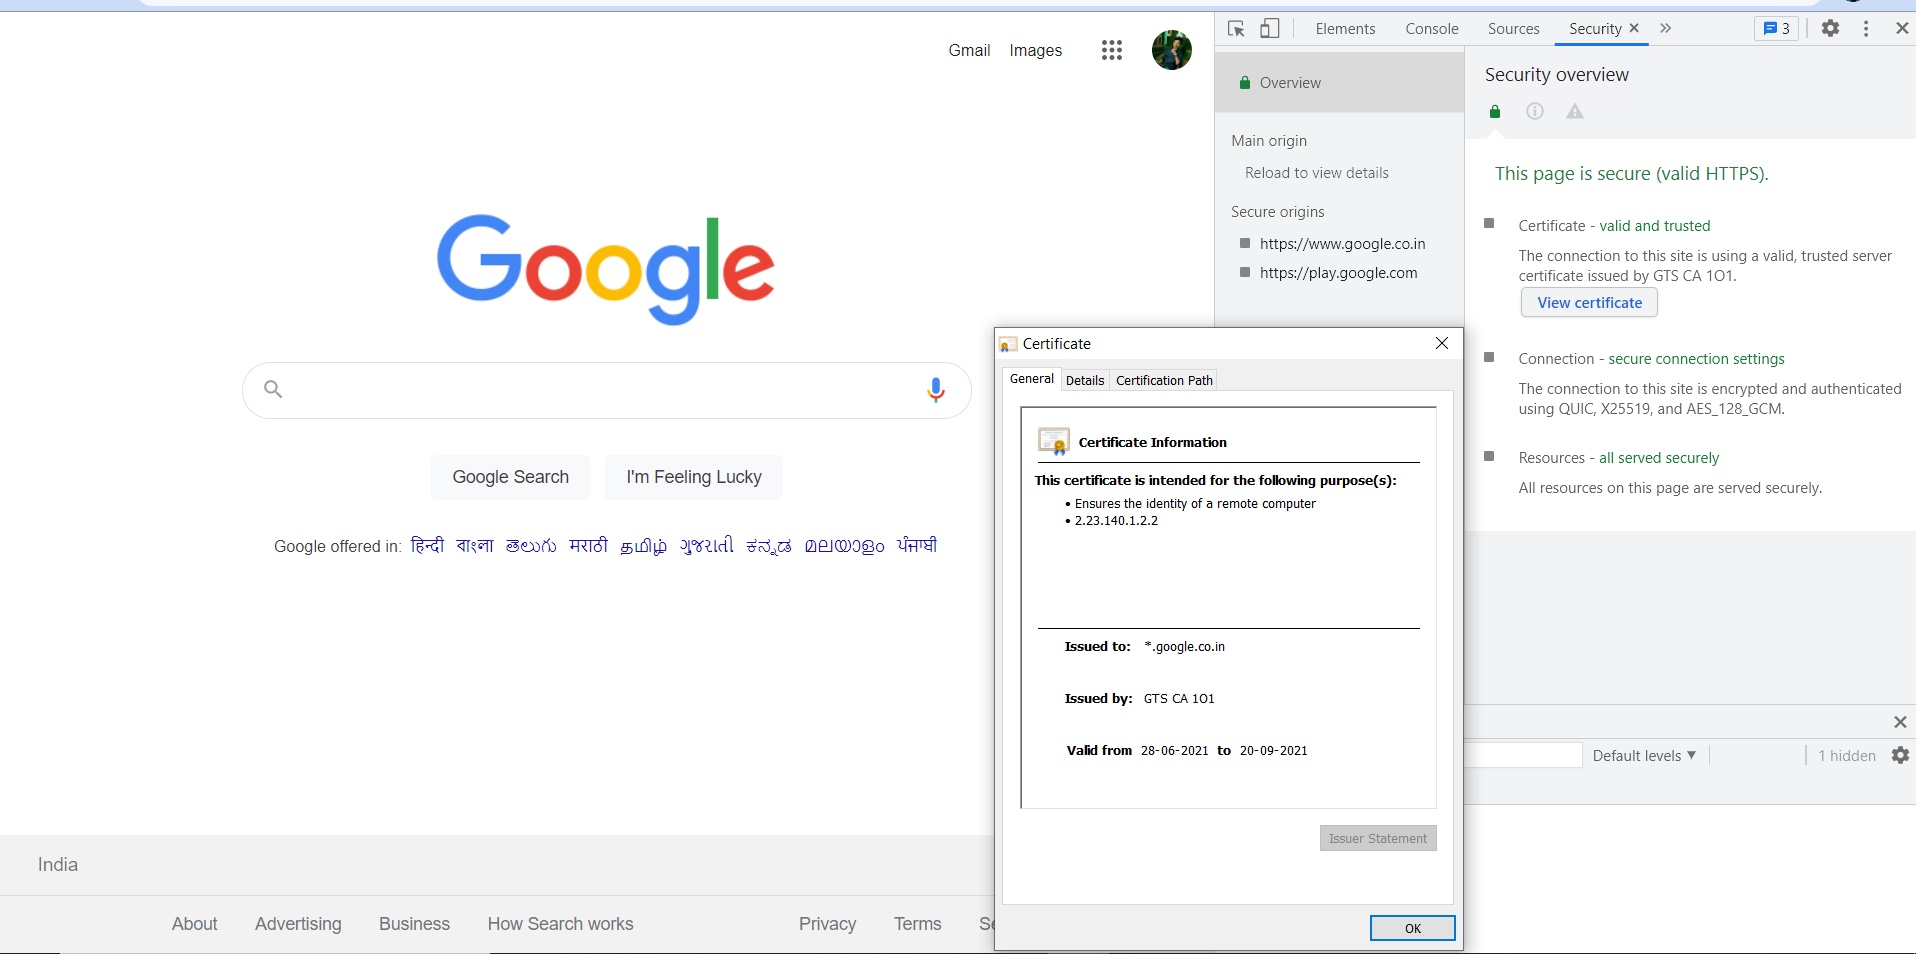
Security
Security gives basic security information, letting view a site’s HTTPS certificate and TLS status.
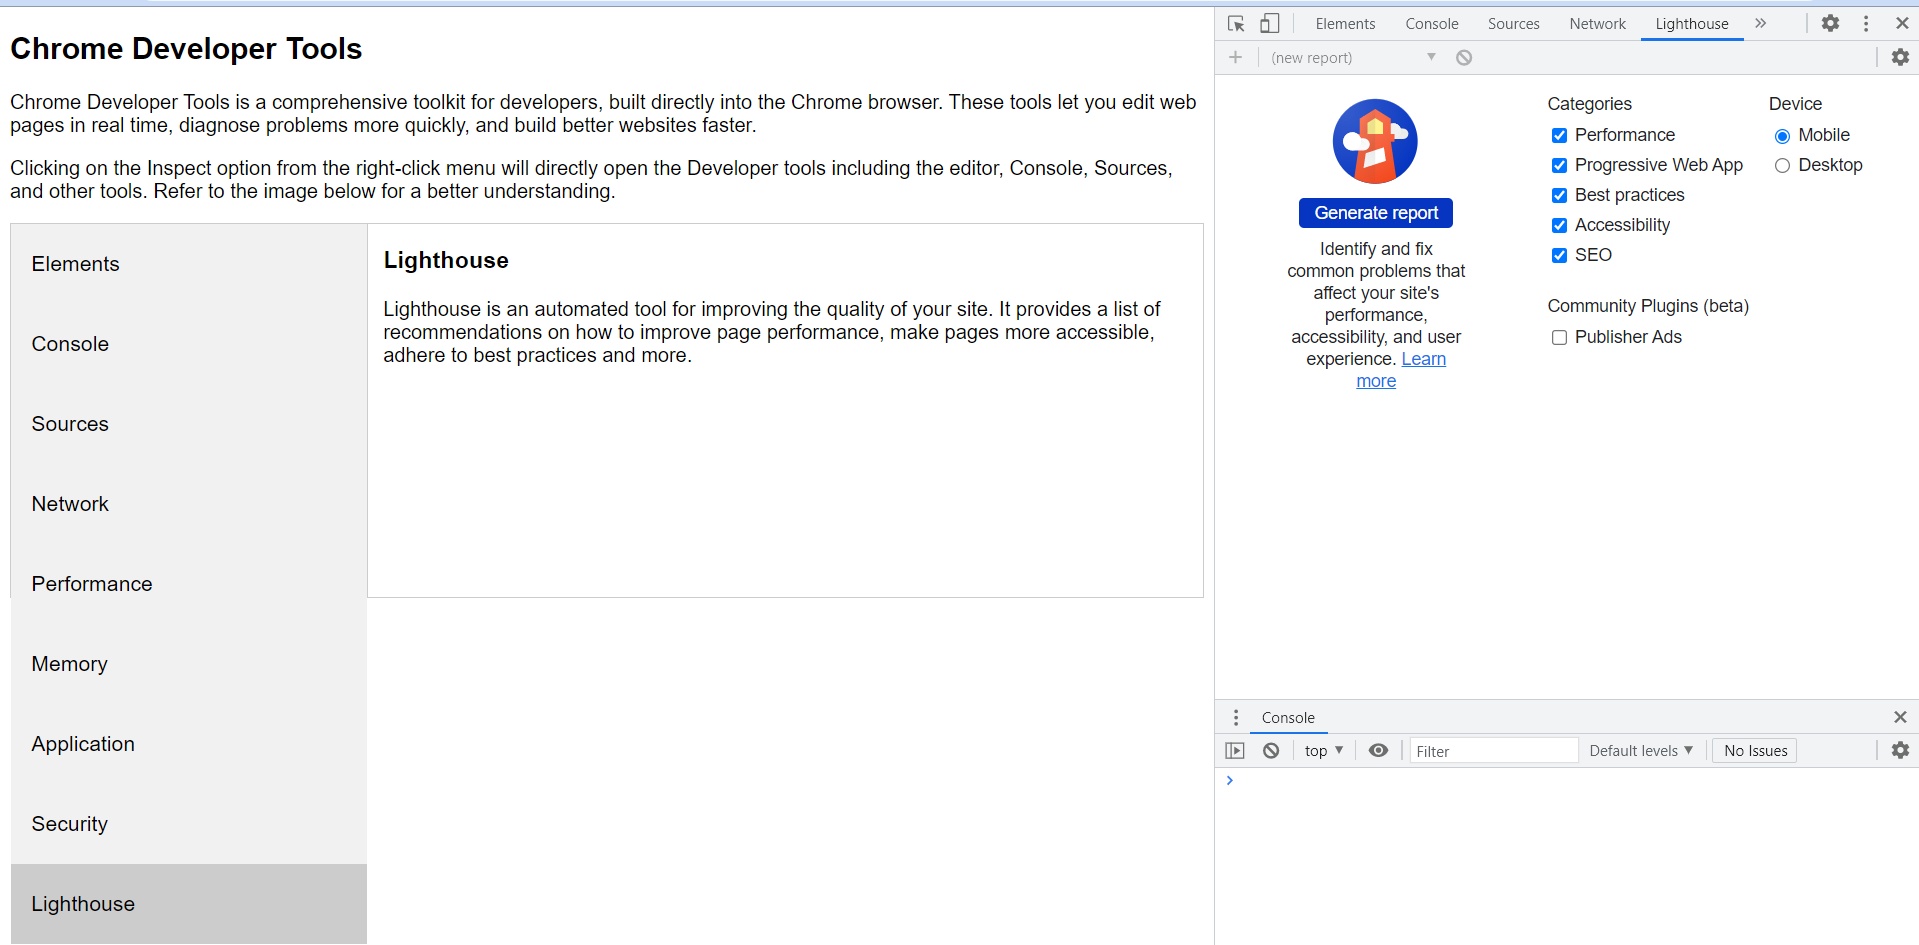
Lighthouse
Lighthouse is an automated tool for improving the quality of the site. It provides a list of recommendations on how to improve page performance, make pages more accessible, adhere to best practices and more.